Weed Withdrawal Journal: Free Printable Tracker
Tools
5-7 Days
Most people spot clear symptom patterns within 5 to 7 days of tracking, turning a chaotic withdrawal experience into concrete evidence that your brain is recalibrating.
Budney et al., Journal of Abnormal Psychology, 2003
Budney et al., Journal of Abnormal Psychology, 2003
If you only read one thing
Write down 6 things every day for 2 minutes: what symptoms you have, how intense they are (1-10), how you slept, your mood, how many cravings you had, and one good thing that happened. Within 5 to 7 days you'll start seeing clear patterns — like when cravings hit hardest or when sleep started improving. That data is the best weapon against your brain telling you nothing is getting better, because the numbers don't lie even when withdrawal makes everything feel hopeless.
A weed withdrawal tracker does something simple but powerful: it converts a vague, overwhelming experience into concrete data you can actually look at. When you are three days into quitting and everything feels terrible, it is hard to believe that anything is improving. But when you can look at a row of numbers and see that your anxiety dropped from an 8 on day two to a 5 on day five, you have evidence that your brain is recalibrating. That evidence matters more than motivation alone.
This article gives you a ready-to-use daily tracker template, explains what to log and why each category matters, walks through a sample week so you can see the tool in action, and covers how to use the data you collect to stay on track through the hardest stretch.
Key Takeaways
- Tracking your withdrawal symptoms daily turns a chaotic experience into something you can actually observe, measure, and manage
- The most useful things to log each day are symptom type, intensity (1 to 10), sleep quality, mood, craving frequency, and one small win
- Most people spot clear patterns within the first 5 to 7 days of tracking — which makes the discomfort feel less random and more temporary
- A simple pen-and-paper or notes-app tracker works just as well as a fancy app, and writing things down is itself a grounding exercise during tough moments
- If your tracker shows symptoms not improving after 3 to 4 weeks — or intensity stuck at 7 or above past day 10 — that data becomes a valuable tool to bring to a healthcare provider
Why Tracking Withdrawal Symptoms Works
Cannabis withdrawal is well-documented. The complete cannabis withdrawal guide covers the full clinical picture, and the withdrawal timeline maps when specific symptoms tend to peak and resolve. But knowing the general timeline is different from seeing your own data.
Tracking Template
Daily Withdrawal Tracker
Sample entry for Day 3 — the typical intensity peak
4 hrs, quality 2/5
3/5
Intensity 7/10, 5 episodes
2/5
Physical Symptoms
Notes
“Hardest day so far. Cravings hit after work. Went for a walk instead. Appetite still gone but forced myself to eat something small.”
Keep it under 2 minutes. If it feels like a chore, track fewer categories. Consistency beats detail.
Tracking works for three specific reasons.
Pattern recognition. Withdrawal symptoms are not random. They follow a neurological sequence as your endocannabinoid system recalibrates. But that sequence can be hard to perceive when you are inside it. A tracker lets you step back and notice that your insomnia peaked on days 3 and 4 but started improving on day 5, or that your cravings are strongest between 6 PM and 10 PM. Once you see a pattern, you can plan around it.
Objective evidence of progress. Your brain during withdrawal is not a reliable narrator. Withdrawal amplifies negativity bias, making it feel like everything is getting worse even when the data shows otherwise. A tracker gives you a factual counterpoint to that distorted perception. When your mood score was a 3 on day two and a 5 on day seven, that is not a feeling. That is a measurement.
Sense of agency. Writing something down is an act of observation rather than helplessness. You are not just enduring withdrawal. You are studying it. That reframe, from passive suffering to active monitoring, changes your relationship to the discomfort. It puts you in the position of someone running an experiment on their own recovery, which is exactly what you are doing. If you prefer a digital tracker to pen and paper, the best apps for quitting weed reviews several options with built-in symptom logging and progress tracking.
What to Track Each Day
Keep it to six categories. More than that and you will stop doing it by day three.
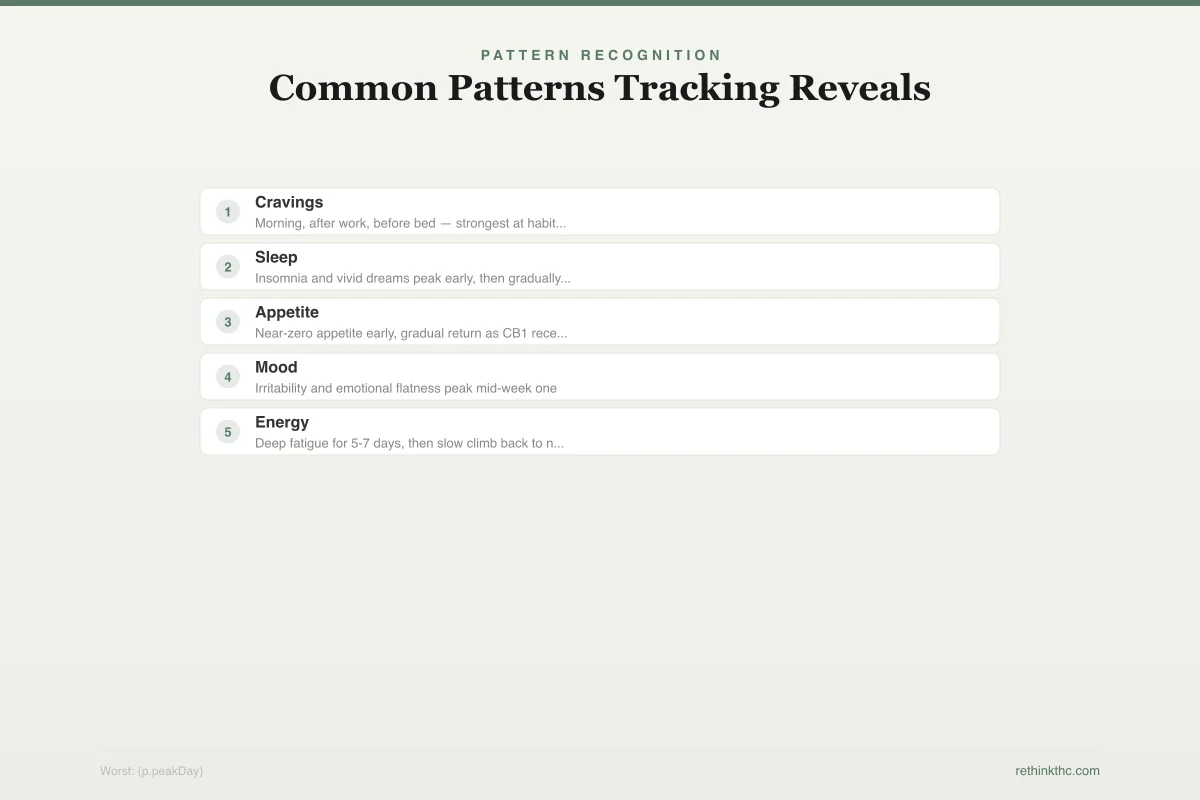
Pattern Recognition
Common Patterns Tracking Reveals
Mini-trends across the first week (1 = worst, 5 = best)
Spike at usual smoking times
Morning, after work, before bed — strongest at habitual use windows
Worst nights 2-5, improves by week 2
Insomnia and vivid dreams peak early, then gradually resolve
Returns around day 7-10
Near-zero appetite early, gradual return as CB1 receptors recalibrate
Lowest days 3-5, first good day ~day 8-10
Irritability and emotional flatness peak mid-week one
"Zombie week" then gradual return
Deep fatigue for 5-7 days, then slow climb back to normal
1. Primary symptoms. Write down which withdrawal symptoms are present today. Common ones include anxiety, irritability, insomnia, night sweats, loss of appetite, brain fog, vivid dreams, and cravings. You do not need to track all of them, just the ones you are actually experiencing.
2. Overall symptom intensity (1 to 10). Rate how your symptoms feel as a whole today. A 1 means barely noticeable. A 10 means the worst you have felt since quitting. This single number is the most useful metric in the entire tracker because it gives you a trendline over days and weeks.
3. Sleep quality (1 to 10). Rate how well you slept last night. Include approximate hours if you can. Sleep disruption is one of the most common and most disruptive withdrawal symptoms, and tracking it separately helps you see when it starts to improve independently of your other symptoms.
4. Mood (1 to 10). Rate your overall emotional state. This does not need to be precise. Just a general sense of where you landed today, from 1 (deeply low or agitated) to 10 (genuinely good).
5. Craving count. How many distinct cravings did you notice today? Not the background wanting, but the sharp, specific urges where you actively thought about using. Counting them helps you see that the number typically decreases over time even when each individual craving still feels intense.
6. Daily win. Write down one thing that went well or one positive action you took today. It can be small: "went for a walk," "cooked a meal," "made it through a craving without using." This category exists because withdrawal narrows your attention toward what feels bad. The daily win forces your focus, even briefly, onto what is working.
The Daily Tracker Template
Copy this template into a notebook, spreadsheet, or notes app. One row per day.
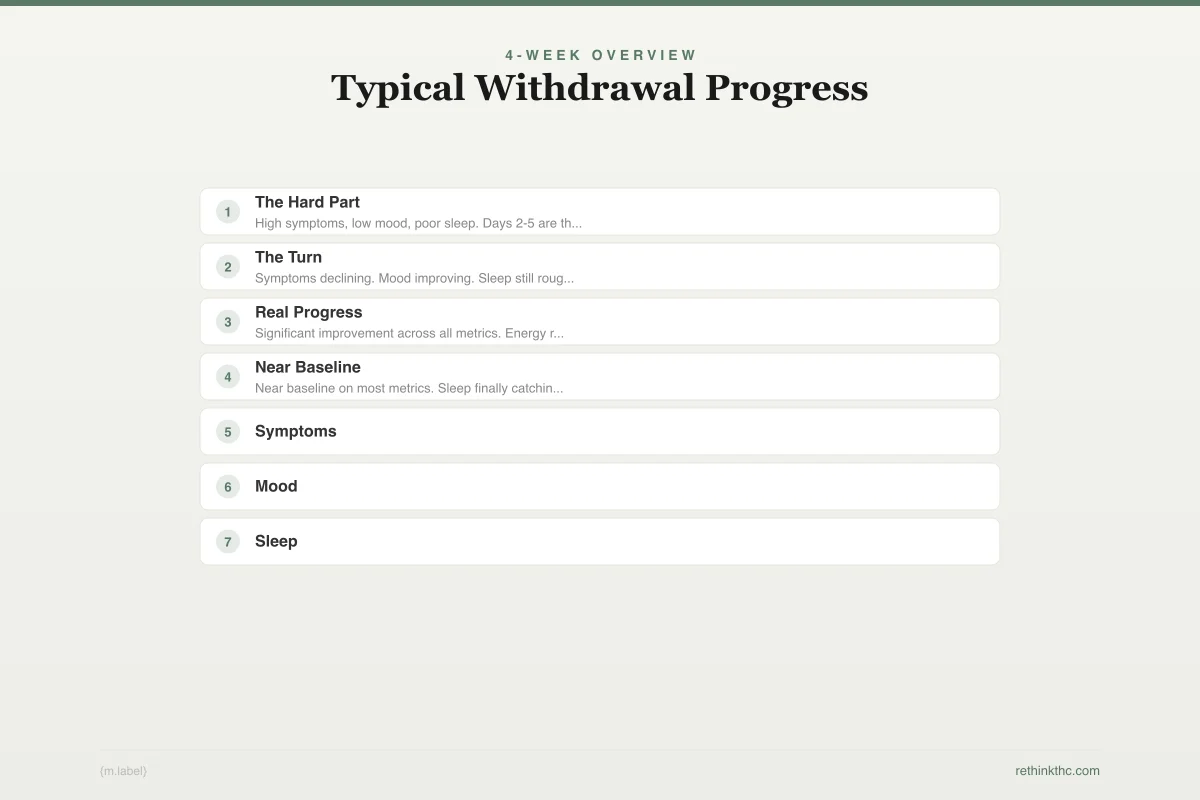
4-Week Overview
Typical Withdrawal Progress
What 4 weeks of tracked withdrawal data typically looks like (1-10 scale)
High symptoms, low mood, poor sleep. Days 2-5 are the peak. Everything feels worse than expected.
Symptoms declining. Mood improving. Sleep still rough but trending better. First "good days" appear.
Significant improvement across all metrics. Energy returning. Appetite normalized. Cravings less frequent.
Near baseline on most metrics. Sleep finally catching up. Occasional mild cravings but manageable.
WEED WITHDRAWAL DAILY TRACKER

Day: ___  Date: ___________

Symptoms present today:
_________________________________

Overall symptom intensity (1-10): ___

Sleep quality (1-10): ___
Hours slept: ___

Mood (1-10): ___

Number of cravings: ___

Today's win:
_________________________________

Notes (optional):
_________________________________
If you prefer a weekly overview format, use this grid:
WEEKLY WITHDRAWAL TRACKER

         Day1  Day2  Day3  Day4  Day5  Day6  Day7
Symptoms  ___   ___   ___   ___   ___   ___   ___
Intensity ___   ___   ___   ___   ___   ___   ___
Sleep     ___   ___   ___   ___   ___   ___   ___
Mood      ___   ___   ___   ___   ___   ___   ___
Cravings  ___   ___   ___   ___   ___   ___   ___
Win       ___   ___   ___   ___   ___   ___   ___
Sample Week: What a Filled-Out Tracker Looks Like
This sample reflects a common pattern for someone quitting after daily use. Your numbers will be different, but the trajectory is typical based on the clinical withdrawal timeline.
Safety Guide
When to Seek Professional Help
Warning signs in your tracker data that mean it is time to talk to someone
Symptoms worsening after day 10
Withdrawal symptoms should be improving by this point. Escalation after the first week may indicate an underlying condition.
Suicidal thoughts at any point
This is not a normal part of cannabis withdrawal. It requires immediate professional attention regardless of when it occurs.
Weight loss exceeding 10% of body weight
Appetite loss is common, but extreme weight loss indicates your body needs medical support.
Complete inability to sleep for 5+ consecutive nights
Some insomnia is expected. Total sleeplessness for nearly a week is beyond typical withdrawal.
Panic attacks (not just anxiety)
Anxiety is common in withdrawal. Full panic attacks with heart racing, chest tightness, and feeling of dying are more serious.
Pre-existing condition worsening
If a condition you were self-medicating with cannabis (depression, PTSD, chronic pain) is getting significantly worse.
SAMHSA National Helpline: 1-800-662-4357 (free, confidential, 24/7). Crisis Text Line: text HELLO to 741741.
| Day 1 | Day 2 | Day 3 | Day 4 | Day 5 | Day 6 | Day 7 | |
|---|---|---|---|---|---|---|---|
| Symptoms | Restless, mild craving | Anxiety, insomnia, sweats | Anxiety, no appetite, irritable | Irritable, vivid dreams, sweats | Anxiety easing, still irritable | Better appetite, some fog | Mood lifting, sleep still rough |
| Intensity | 4 | 7 | 8 | 7 | 6 | 5 | 4 |
| Sleep | 5 | 3 | 2 | 3 | 4 | 4 | 5 |
| Mood | 5 | 3 | 3 | 4 | 5 | 5 | 6 |
| Cravings | 6 | 8 | 5 | 4 | 3 | 3 | 2 |
| Win | Decided to quit | Survived the worst day | Went for a walk | Called a friend | Cooked dinner | Slept 5 hours | One full week done |
Notice the pattern: intensity peaks around days 2 to 3, then starts a gradual decline. Cravings are high early but drop faster than most people expect. Sleep is the slowest category to recover. This matches the clinical data from the first week of quitting weed.
How to Use Your Tracker Data
Review weekly, not daily. Looking at one day's numbers in isolation is not useful. Looking at a full week reveals the trend. Set a weekly check-in where you look back across all seven days and note what improved, what stayed flat, and what is still difficult.
Share it with someone. If you have a friend, partner, or therapist supporting your quit, showing them your tracker gives them something concrete to respond to. Instead of "I feel terrible," you can say "my intensity dropped from 8 to 5 this week but my sleep is still at a 3." That level of specificity makes it easier for others to help.
Use it to time your coping strategies. If your tracker shows that cravings spike every evening between 7 and 9 PM, you can plan an activity for that window before the craving arrives. The anxiety toolkit for withdrawal has specific techniques matched to different time windows that pair well with this kind of pattern data.
Keep going past week one. The first week gets the most attention, but withdrawal symptoms can persist at lower levels for 2 to 4 weeks. Continuing to track through weeks two and three gives you the full picture of your recovery curve and helps you catch any symptoms that stall instead of improving.
When to Seek Professional Help
If your tracker shows symptoms that are not improving after 3 to 4 weeks, or if your intensity, mood, or sleep scores are consistently at the extreme end of the scale, that is useful data to bring to a doctor or therapist. A tracker is not a diagnostic tool, but it gives a clinician a concrete picture of what you have been experiencing and how it has changed over time.
If you need immediate support, the SAMHSA National Helpline is available 24/7 at 1-800-662-4357. It is free, confidential, and available in English and Spanish.
The Bottom Line
A weed withdrawal tracker converts the vague, overwhelming experience of cannabis withdrawal into concrete, observable data. The most effective daily tracker logs six categories: primary symptoms present, overall symptom intensity (1-10), sleep quality (1-10), mood (1-10), craving count, and one daily win. Tracking works through three mechanisms: pattern recognition (identifying that cravings spike at specific times or that insomnia peaked on days 3-4), objective evidence of progress (counteracting the negativity bias that withdrawal amplifies), and a sense of agency (shifting from passive suffering to active monitoring). A sample first-week tracker shows the typical trajectory: intensity peaking around days 2-3, cravings high early but dropping faster than expected, and sleep as the slowest category to recover. Weekly review of tracker data reveals trends invisible in daily snapshots, and sharing data with a support person enables more specific help than vague descriptions of distress.
Sources & References
- 1RTHC-00312·Hasin, Deborah S et al. (2008). “National Survey Found 44% of Frequent Cannabis Users Experienced Withdrawal Symptoms.” The Journal of clinical psychiatry.Study breakdown →PubMed →↩
- 2RTHC-07707·Spiga, Francesca et al. (2025). “Is There a Pill to Help You Quit Cannabis? The Cochrane Review Says Not Yet.” The Cochrane database of systematic reviews.Study breakdown →PubMed →↩
- 3RTHC-00218·Budney, Alan J. et al. (2006). “Paying for Clean Tests Worked During Treatment. Therapy Helped It Last..” Journal of Consulting and Clinical Psychology.Study breakdown →PubMed →↩
- 4RTHC-00166·Haney, Margaret et al. (2004). “Can Oral THC Pills Ease Marijuana Withdrawal? A Controlled Study Says Yes.” Neuropsychopharmacology : official publication of the American College of Neuropsychopharmacology.Study breakdown →PubMed →↩
- 5RTHC-00188·González, Sara et al. (2005). “Comprehensive Review of Cannabis Tolerance and Dependence in Laboratory Animals.” Pharmacology.Study breakdown →PubMed →↩
- 6RTHC-00203·Raphael, Beverley et al. (2005). “Review of Cannabis Health Risks: Psychosis Link Strong, Withdrawal Syndrome Real, Gateway Theory Debated.” Journal of psychiatric practice.Study breakdown →PubMed →↩
- 7RTHC-00159·Budney, Alan J. et al. (2004). “Yes, Cannabis Withdrawal Is Real. This 2004 Review Mapped What It Looks Like..” American Journal of Psychiatry.Study breakdown →PubMed →↩
- 8RTHC-00019·Jones, R T et al. (1981). “Cannabis Tolerance Developed Rapidly and Withdrawal Symptoms Appeared After Just One Week of Use.” Journal of clinical pharmacology.Study breakdown →PubMed →↩