THC Purity and Potency: What the Label Actually Means
Product Types
32%
Lab testing found that identical cannabis samples returned THC potency results differing by up to 10 percentage points, exposing serious inconsistencies in the numbers consumers trust.
Jikomes & Zoorob, PLOS ONE, 2020
Jikomes & Zoorob, PLOS ONE, 2020
View as imageIf you only read one thing
The THC percentage on a cannabis label is not what most people think it is. It's a theoretical maximum based mostly on THC-A (the inactive form), and identical samples can come back 5–10 points apart at different labs. Higher numbers also don't automatically mean a better or stronger experience — the terpene profile, minor cannabinoids, and your own tolerance shape the high more than a single percentage. The real info is in the Certificate of Analysis: check it for contaminants, not just potency.
You pick up a jar at the dispensary. The label says 32% THC. The one next to it says 24%. Most people reach for the higher number, assuming it means a stronger, better product. But understanding THC purity and potency label meaning requires looking past that single number, because it is telling you far less than you think. In many cases, the number on the label is technically accurate but practically misleading. And in some cases, it is not even accurate.
This is not about whether cannabis is good or bad. It is about making sure you know what you are actually buying, consuming, and putting into your body.
Key Takeaways
- The THC percentage on a cannabis label almost never shows how much active THC is in the product right now — it is a calculation based on THC-A, the inactive form that only becomes THC when you heat it
- "Total THC" uses the formula THC + (THC-A x 0.877) to account for weight lost during heating — the process that activates the compound, which is what THC purity potency label meaning actually comes down to
- Lab testing accuracy varies wildly across states and even between labs in the same state — some studies found the same sample returning results that differ by 10 percentage points or more
- A Certificate of Analysis (COA) is the only reliable way to verify what is actually in a cannabis product — and learning to read one takes about five minutes
- Higher THC numbers do not automatically mean a stronger or better experience, because terpenes, minor cannabinoids, and your own tolerance all shape how a product actually feels
- A 2020 study in PLOS ONE found that the same cannabis sample returned potency results differing by 5 to 10 percentage points depending on which lab tested it — exposing serious inconsistencies in the numbers consumers trust
THC vs. THC-A: The Number You See Is Not the Number You Get
What the THC Label Actually Tells You (and What It Hides)
Inactive precursor — only becomes THC when heated (decarboxylation)
Most of what the lab measured; requires heat to activate
Calculated: THC + (THC-A × 0.877)
Assumes 100% conversion — real-world use never achieves this
THC concentration in the product
Does not tell you how much you will absorb — method matters
Absence of contaminants (pesticides, solvents, heavy metals)
High potency ≠ high purity — a product can be strong and contaminated
The most common source of confusion starts with a basic chemistry fact. Raw cannabis flower does not contain much active THC. What it contains is THC-A (tetrahydrocannabinolic acid), a non-psychoactive precursor molecule. THC-A does not get you high. It only becomes active THC through a process called decarboxylation, which is a technical word for applying heat. When you light a joint, use a vaporizer, or bake flower into edibles, the heat strips a carboxyl group off the THC-A molecule, converting it into the THC that actually binds to your brain's cannabinoid receptors.
Chemical Conversion
THC-A to THC: What Actually Happens
THC-A
Raw cannabis
Non-psychoactive
HEAT
Decarboxylation
THC
After heating
Psychoactive
The Formula
Total THC = THC + (THC-A × 0.877)
The 0.877 multiplier accounts for molecular weight lost during conversion
Example: A Label Shows 25% THC-A + 1% THC
The number on the label is usually THC-A, not active THC. Real-world absorption is lower than the theoretical maximum due to incomplete conversion during smoking or vaping.
Here is why this matters for labels. When a lab tests cannabis flower, most of what it measures is THC-A, not active THC. The "Total THC" number you see on the package is a calculated estimate using a standard formula:
Total THC = THC + (THC-A x 0.877)
The 0.877 multiplier accounts for the molecular weight lost when that carboxyl group drops off during heating. A product that tests at 36% THC-A and 0.5% active THC would display a Total THC of roughly 32%. That number assumes perfect, complete conversion, which almost never happens in real-world use. Depending on your consumption method, temperature, and technique, you may be getting significantly less active THC than the label suggests.
Smoking, for example, involves combustion temperatures that can destroy some THC before you inhale it. Vaporizing is more efficient but still does not achieve 100% conversion. For a detailed comparison of how much THC each method actually delivers to your system, see the harm reduction guide to vaping vs smoking vs edibles. The point is that the label gives you a theoretical maximum under ideal conditions, not a reflection of what your body will actually absorb.
Why Lab Numbers Vary So Much
Even setting aside the THC-A conversion issue, the testing process itself is less precise than most consumers realize. Cannabis testing labs operate under state-level regulations, and those regulations differ significantly from one state to the next. There is no single federal standard for how cannabis should be tested, what methods labs must use, or how results should be reported.
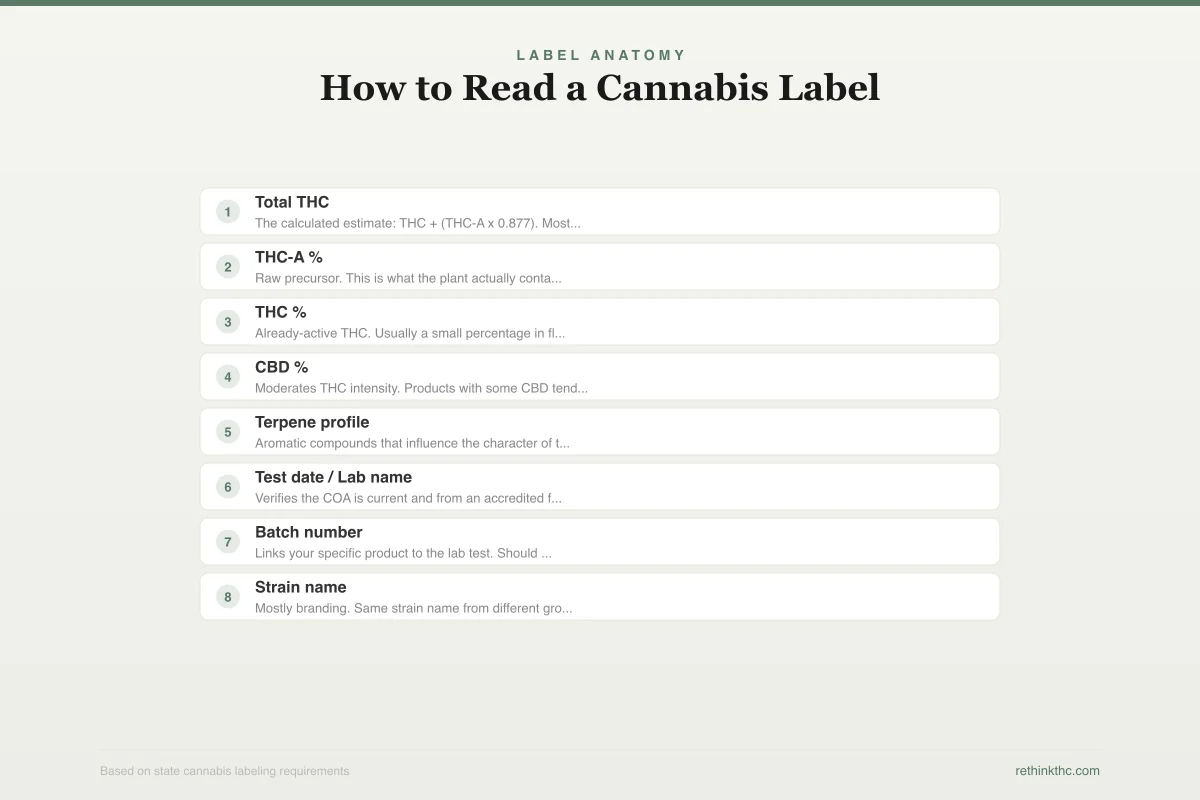
Label Anatomy
How to Read a Cannabis Label
What matters, what helps, and what is mostly marketing
Total THC
CriticalThe calculated estimate: THC + (THC-A x 0.877). Most relevant number for expected potency.
THC-A %
CriticalRaw precursor. This is what the plant actually contains before you apply heat.
THC %
ImportantAlready-active THC. Usually a small percentage in flower, higher in concentrates.
CBD %
ImportantModerates THC intensity. Products with some CBD tend to produce a different, often smoother experience.
Terpene profile
ImportantAromatic compounds that influence the character of the high. Two products at the same THC can feel very different.
Test date / Lab name
ImportantVerifies the COA is current and from an accredited facility. Stale or missing data is a red flag.
Batch number
UsefulLinks your specific product to the lab test. Should match the COA if you look it up.
Strain name
MarketingMostly branding. Same strain name from different growers can have very different profiles.
A 2020 study published in the journal PLOS ONE examined the consistency of cannabis potency testing and found substantial variability between labs analyzing the same samples. Differences of 5 to 10 percentage points for the same flower were not unusual. Some of this variation comes from differences in testing equipment, sample preparation methods, and calibration standards. Some of it comes from which part of the plant gets tested. The top of the bud near the trichome-rich surface will test higher than material from the middle or bottom of the same plant.
This creates a problem known as potency inflation. In competitive legal markets, higher THC numbers sell better. Cultivators and brands have a financial incentive to shop for labs that consistently return higher results, or to submit their best-looking buds for testing rather than a representative sample of the whole batch. Some states have implemented stricter sampling protocols to combat this, but enforcement is inconsistent.
A 2022 report from labs in multiple legal states confirmed what many in the industry already suspected: the average THC percentage listed on dispensary flower has been climbing faster than breeding advances alone can explain. Part of that climb is genuine genetic improvement. Part of it is testing practices that favor higher numbers.
How to Read a Certificate of Analysis
A Certificate of Analysis (COA) is the lab report that backs up the numbers on a product label. Many states require that COAs be available to consumers, either through a QR code on the packaging, through the dispensary's website, or upon request. Learning to read one gives you a much more complete picture than the label alone.
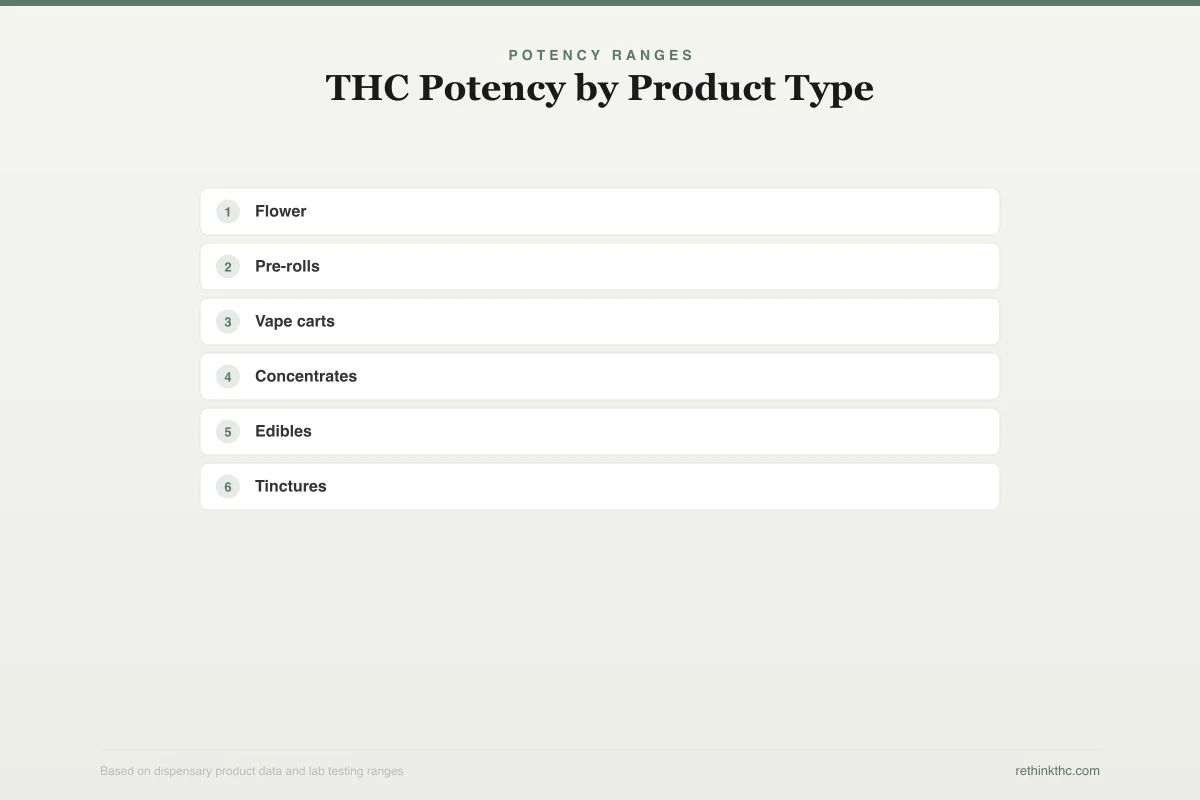
Potency Ranges
THC Potency by Product Type
Full range (bar) vs common range (darker). Concentrates and vapes are 3-6x stronger than flower.
Flower
15-30% % THC
Pre-rolls
15-25% % THC
Vape carts
70-95% % THC
Concentrates
60-90% % THC
Edibles
5-100 mg/pkg
Tinctures
10-50 mg/mL
Topicals have variable THC content with minimal systemic absorption. They are not included because the THC does not reach your bloodstream in meaningful amounts.
Here is what to look for:
Cannabinoid profile. This section lists THC-A, THC, CBD-A, CBD, and sometimes minor cannabinoids like CBG, CBN, and CBC. Pay attention to the THC-A and Total THC distinction. Also note the CBD content. Products with some CBD present tend to produce a different experience than pure THC products, because CBD moderates some of THC's more intense effects. If you are interested in how different cannabinoid ratios affect your experience, the article on how cannabis products are made explains how processing choices change what ends up in the final product.
Terpene profile. Some COAs include terpene testing. Terpenes are the aromatic compounds that give different strains their distinct smell and may influence the character of the high. Myrcene, limonene, linalool, and beta-caryophyllene are among the most common. Two products with identical THC percentages can feel quite different depending on their terpene profiles.
Contaminant testing. This section covers pesticides, heavy metals, residual solvents (in concentrates), microbial contamination (mold, bacteria), and sometimes mycotoxins. A clean contaminant panel matters far more for your health than an extra 2% THC. This is the section that tells you whether the product is safe, not just strong.
Batch and sample information. A legitimate COA will list the batch number (matching what is on your package), the date of testing, and the name of the accredited lab. If this information is missing or does not match, treat it as a red flag.
Why the Highest THC Number Is Not Always the Best Choice
The cannabis market's fixation on THC percentages mirrors the alcohol market's relationship with proof. Consumers assume higher numbers mean better products, but that is not how the pharmacology works.
Testing Accuracy
Problems with Cannabis Lab Testing
Why the number on the label may not match what is in the product
Lab shopping
HighCultivators and brands select labs that consistently return higher THC numbers to make products more marketable
Potency inflation
HighStudies find THC readings 10-15% higher than actual content. Dispensary flower THC has climbed faster than breeding can explain.
Sample bias
ModerateLabs test a small sample, often the best-looking buds. The tested sample may not represent the bulk product you purchase.
Inter-lab variance
HighThe same cannabis sample tested at different labs can return results differing by 5-10 percentage points.
Regulatory inconsistency
ModerateNo federal testing standard. Different states require different testing methods, equipment, and reporting formats.
Conversion assumptions
LowTotal THC formula assumes 100% decarboxylation, which never happens in practice. Real-world THC is lower than labeled.
Be skeptical of flower claiming 35%+ Total THC. Check the Certificate of Analysis (COA) via the QR code on the package for the full lab report.
THC has a well-documented biphasic effect. At lower doses, it tends to produce relaxation, euphoria, and stress relief. At higher doses, the same compound can trigger anxiety, paranoia, and an uncomfortable racing mind. The dose that helps and the dose that hurts can be closer together than most people expect. This is one of the reasons microdosing cannabis has gained traction as a strategy for people who want therapeutic effects without the intensity that comes with high-potency products.
Beyond the biphasic effect, the "entourage effect" theory suggests that the overall cannabis experience comes from the interaction of multiple compounds working together, not just THC alone. Terpenes, CBD, and minor cannabinoids may all contribute. A 22% THC flower with a rich terpene profile and some CBD content may feel more pleasant and effective than a 30% THC product that has been bred or processed to maximize a single number at the expense of everything else.
This does not mean high-potency products have no place. For people with significant tolerance or specific medical needs, higher THC content may be appropriate. But for many consumers, especially those who are newer to cannabis or returning after a long break, chasing the highest number on the shelf is a reliable path to an uncomfortable experience. Understanding how THC potency has increased over time helps put today's numbers in historical context.
What "Purity" Actually Means
Potency and purity are related but different concepts. Potency refers to the concentration of THC (or other cannabinoids) in a product. Purity refers to how free the product is from unwanted substances like pesticides, solvents, heavy metals, and biological contaminants.
A product can be high-potency but low-purity if it contains 85% THC along with residual butane from a sloppy extraction process. Conversely, a product can be lower-potency but high-purity if it is clean, well-grown flower with a modest THC percentage and a clean contaminant panel.
For concentrates and vape cartridges, purity matters especially. The extraction process that creates these products can concentrate contaminants along with cannabinoids. A certificate of analysis showing clean panels for residual solvents, pesticides, and heavy metals is arguably more important than the THC number itself. If you want to understand the differences between product forms and how each is manufactured, the article on how concentrates and edibles are made walks through the major methods.
Safety
ModerateUnregulated vape carts can concentrate contaminants along with THC
Concern
Extraction processes used for concentrates and vape cartridges pull out cannabinoids — but they can also pull out and concentrate residual pesticides, heavy metals, and leftover solvents from the extraction itself. A clean COA on the flower doesn't guarantee a clean vape cart.
What the research says
For inhaled concentrates especially, a Certificate of Analysis covering residual solvents, heavy metals, and pesticides is more important than the THC number. Unlicensed or untested products carry meaningfully higher contamination risk.
Particularly relevant for: Anyone using vape cartridges, dabs, or other concentrate products — especially from unregulated/street-market sources
What to do
Scan the QR code on legal packaging and check the full COA — not just cannabinoid content. Avoid vape products from sources that can't produce one.
State cannabis testing regulations and review literature on extract contamination
Practical Tips for Smarter Label Reading
You do not need a chemistry degree to make better-informed decisions at the dispensary. Here are some straightforward practices:
Look at Total THC, not just THC. The "THC" line on a label usually reflects only the small amount of active THC present before heating. "Total THC" is the more relevant number, though it still represents a theoretical maximum.
Check the COA if available. Scan the QR code. Look at the full cannabinoid profile, not just the headline number. Note the terpene profile and the contaminant results.
Be skeptical of outlier numbers. If a flower product claims 35% or higher Total THC, approach it with healthy skepticism. Those numbers exist but are rare, and some labs have been caught inflating results.
Consider starting lower. Especially if you are new, returning after a break, or sensitive to THC, choosing a product in the 15-20% range may give you a better overall experience than jumping straight to the top shelf. Following safer cannabis use guidelines can help you find a dose and product type that works without overdoing it.
Remember that THC percentage does not predict experience. Two strains at the same percentage can produce very different effects. Your own biology, tolerance, setting, and mental state all play a role.
When to Seek Support
If you find that you are consistently needing higher-potency products to feel the same effects, or if you are experiencing withdrawal symptoms when you stop using cannabis, that is worth paying attention to. Tolerance escalation is a normal biological response, but it can also be an early signal of Cannabis Use Disorder. The complete guide to cannabis withdrawal explains what to expect and when professional help makes sense.
If you or someone you know is struggling with substance use of any kind, free support is available. Contact the SAMHSA National Helpline at 1-800-662-4357 for confidential treatment referrals 24 hours a day, 7 days a week. You can also reach the Crisis Text Line by texting 741741 from anywhere in the U.S.
The Bottom Line
THC label numbers are less informative than consumers assume. THC-A vs THC: raw flower contains THC-A (non-psychoactive precursor); labels show "Total THC" calculated as THC + (THC-A × 0.877), representing theoretical maximum under perfect decarboxylation — real-world absorption is lower depending on consumption method. Lab testing inconsistency: 2020 PLOS ONE study found same sample returns results differing by 5-10 percentage points between labs; no federal standard for testing methods, equipment, calibration. Potency inflation: competitive markets incentivize higher numbers — cultivators shop for favorable labs, submit best buds rather than representative samples. COA (Certificate of Analysis) reading: cannabinoid profile (THC-A/THC/CBD distinction), terpene profile (influences experience character), contaminant testing (pesticides, heavy metals, residual solvents, microbials — more important than extra THC%), batch/sample verification. Biphasic effect: lower THC doses → relaxation/euphoria; higher doses → anxiety/paranoia. Entourage effect theory: terpenes + CBD + minor cannabinoids interact to shape experience — 22% THC with rich profile may outperform 30% THC bred for single-number maximization. Potency vs purity distinction: potency = THC concentration; purity = freedom from contaminants. High-potency low-purity products (residual solvents, pesticides) are worse than lower-potency clean products. Concentrates especially need clean COA panels.
Sources & References
- 1RTHC-07406·Prete, Mariana M et al. (2025). “Synthetic Cannabinoids Cause Far More Severe Side Effects Than Natural Cannabis.” Drug and alcohol dependence.Study breakdown →PubMed →↩
- 2RTHC-07483·Ricci, Valerio et al. (2025). “Synthetic Cannabinoids Carry 4-5 Times Higher Psychosis Risk Than Natural Cannabis.” Neuroscience and biobehavioral reviews.Study breakdown →PubMed →↩
- 3RTHC-07495·Rittiphairoj, Thanitsara et al. (2025). “Major Review: High-THC Cannabis Products Tied to Psychosis and Addiction, Mixed Results for Anxiety and Depression.” Annals of internal medicine.Study breakdown →PubMed →↩
- 4RTHC-03119·ElSohly, Mahmoud A et al. (2021). “U.S. Cannabis Potency Update Through 2019: THC Rose, Then CBD Made a Comeback.” Biological psychiatry. Cognitive neuroscience and neuroimaging.Study breakdown →PubMed →↩
- 5RTHC-00782·Castaneto, Marisol S et al. (2014). “Comprehensive review of synthetic cannabinoids: far more potent and dangerous than THC.” Drug and alcohol dependence.Study breakdown →PubMed →↩
- 6RTHC-02301·Solowij, Nadia et al. (2019). “Low-dose CBD enhanced THC intoxication while high-dose CBD reduced it, especially in infrequent users.” European archives of psychiatry and clinical neuroscience.Study breakdown →PubMed →↩
- 7RTHC-01233·Newmeyer, Matthew N et al. (2016). “How Long Cannabis Stays in Your Blood Depends on How You Consume It.” Clinical chemistry.Study breakdown →PubMed →↩
- 8RTHC-07595·Schmidt, Laura A et al. (2025). “Child Cannabis Poisonings Increased Significantly After California Legalization.” American journal of preventive medicine.Study breakdown →PubMed →↩